After a brief introduction about Regression Analysis and Simple Linear Regression, let’s get our hands dirty on “Simple Linear Regression Analysis” using Python.
For this we will use salary.csv, which has two columns. First column is the Years of experience and the second column is the Salary. I have used “Jupyter NoteBook” to execute the python code, but you can use any editor of your choice.
Step 1
- Understand the data for which you are going to build the model.
- Determine which column will be independent variable (X) and which will be dependent variable (y)
Step 2
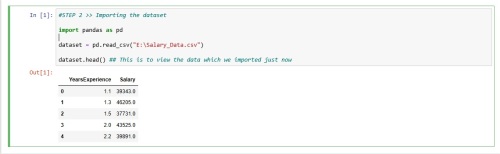
- Import the data → For this we will use pandas library.
import pandas as pd
dataset = pd.read_csv("E:\Salary_Data.csv")
dataset.head() ## This is to view the data which we imported just now
Step 3
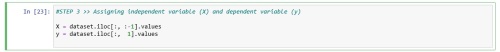
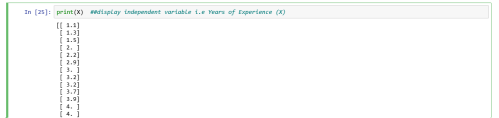
- Create a variable in python say (X) and assign independent variable to it. In this case independent variable is Year of Experinece.
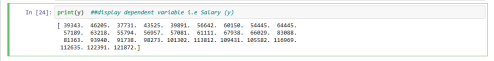
- Create another variable in python say (y) and assign dependent variable to it. In this case dependent variable is Salary.
X = dataset.iloc[:, :-1].values
y = dataset.iloc[:, :1].values
Step 4
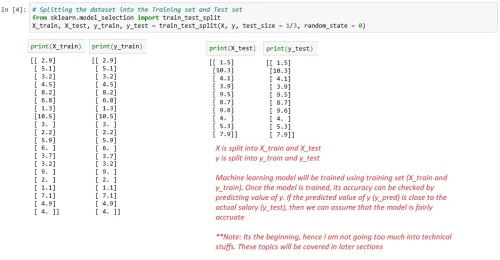
- Splitting the data into training set and test set → For this we will use training_test_split library from sklearn.model_selection module.
- In this step sample data is split into two sets – training set and test set.
- Size of training set and test set depends on test_size parameter. In this case test_size is 1/3, which means training set will have 2/3 of the rows and test set will have 1/3 of the rows from the sample data.
- random_state parameter → If the random_state parameter is set to None, each time we execute train_test_split, we will get a different result. But, if we set random_state parameter to some fixed value like “1”, the each time we execute train_test_split, we are guarantee to get the same result. During development, we generally use fixed value for random_state parameter, so that we get consistence split for comparison.
# Splitting the dataset into the Training set and Test set
from sklearn.model_selection import train_test_split
X_train, X_test, y_train, y_test = train_test_split(X, y, test_size = 1/3, random_state = 0)
Step 5
- Fitting the simple linear model to training set (i.e. Train the algorithm)
- For this we use LinearRegression library from sklearn.linear_model module
# Fitting Simple Linear Regression to the Training set

from sklearn.linear_model import LinearRegression

regressor = LinearRegression()
regressor.fit(X_train, y_train)
Step 6
- Predicting the test set → Once the model is trained, we will test the model by providing test data (X_test i.e Years of Experience) . The result (y_pred i.e. Predicted Salary ) obtained will be compared with y_test(Actual Salary). If the predicted salary (result) is close enough to actual salary, we can assume that our model is sufficiently trained and can be used to predict salary based on No. of years of experience.
[Note: To satisfactorily confirm, if the model used is proper or not, certain assumptions are made and some checks are performed. These topics will be covered in later sections]
#Predicting the Test set results.
#For each record in X_test (i.e for each No. of Year),
#we will predict the salary i.e. the value of y

y_pred = regressor.predict(X_test)
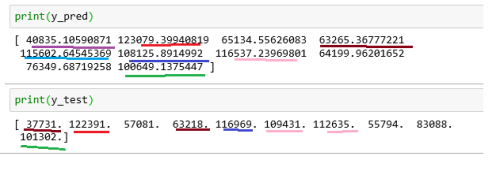
As you can see above, except for 3rd, 8th and 9th salary, all other salary are very close. So the model was able to predict salary.
Step 7
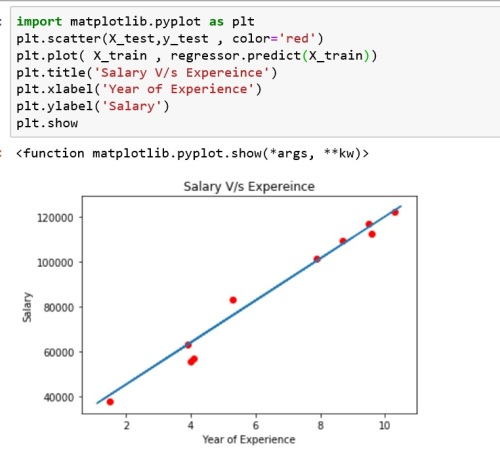
- Compare the predicted salary with actual salary → In this step we will use matplotlib.pyplot library to compare actual salary versus predicted salary.
- Actual salary (y_test) will be plotted against Year of experience (X_test). In the same graph regression line representing predicted salary (y_pred) against Year of experience (X) will be drawn.
#Visualize the actual salary versus predicted salary

import matplotlib.pyplot as plt
plt.scatter(X_test,y_test , color='red')
plt.plot( X , regressor.predict(X))
plt.title('Salary V/s Expereince')
plt.xlabel('Year of Experience')
plt.ylabel('Salary')
plt.show

Leave a comment